Get For Free
Energy Monitoring System
Developed an interactive website for Nakayama Company to showcase electrical energy usage data, utilizing PHP and the ChartJS library for dynamic and engaging visualizations. This solution provides real-time insights into energy consumption, enabling informed decision-making for efficient energy management
Details
Frontend Developer
Nakayama Iron Works
Stack:
PHP
Python
ChartJs
JavaScript
2022
Overview
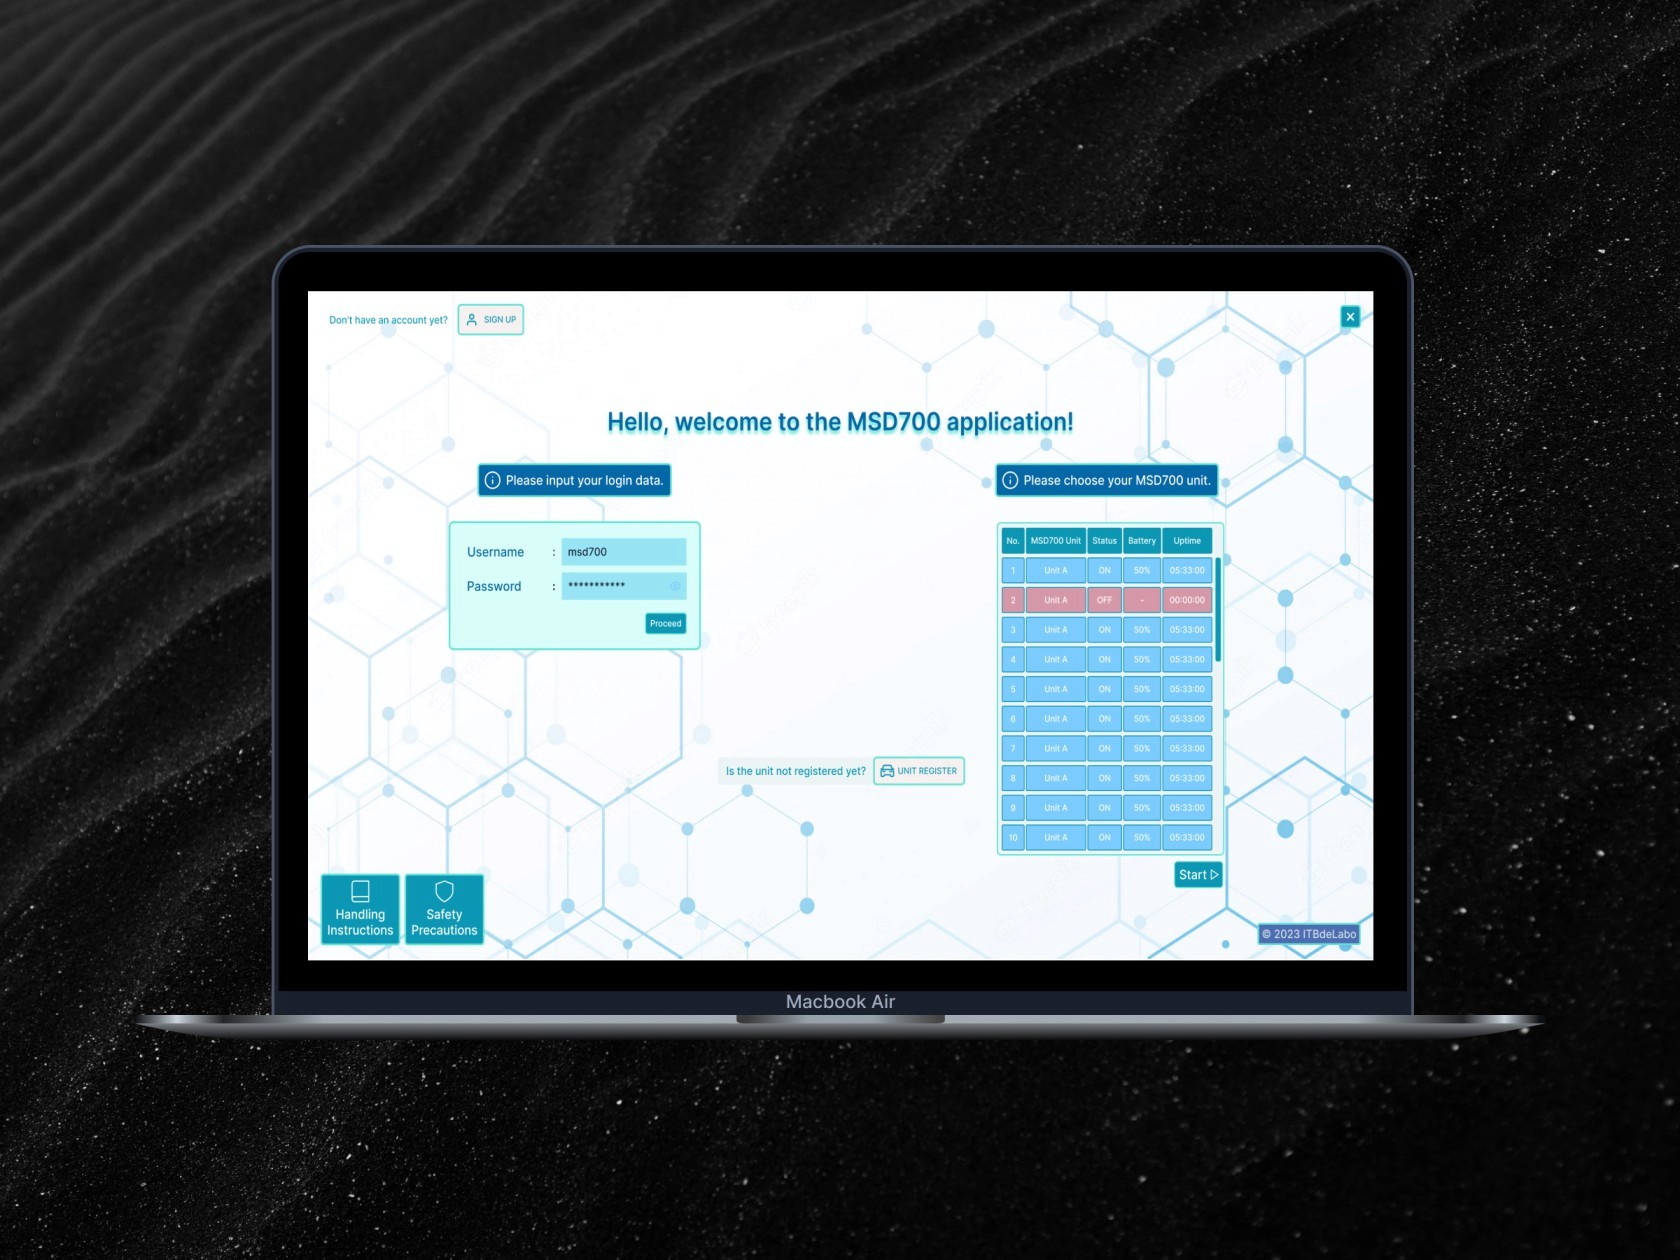
This project was developed to monitor and optimize energy usage within a laboratory setting. By leveraging real-time data from smart plugs, this system provides insights into energy consumption patterns, enabling the lab to manage resources effectively.
Key Features
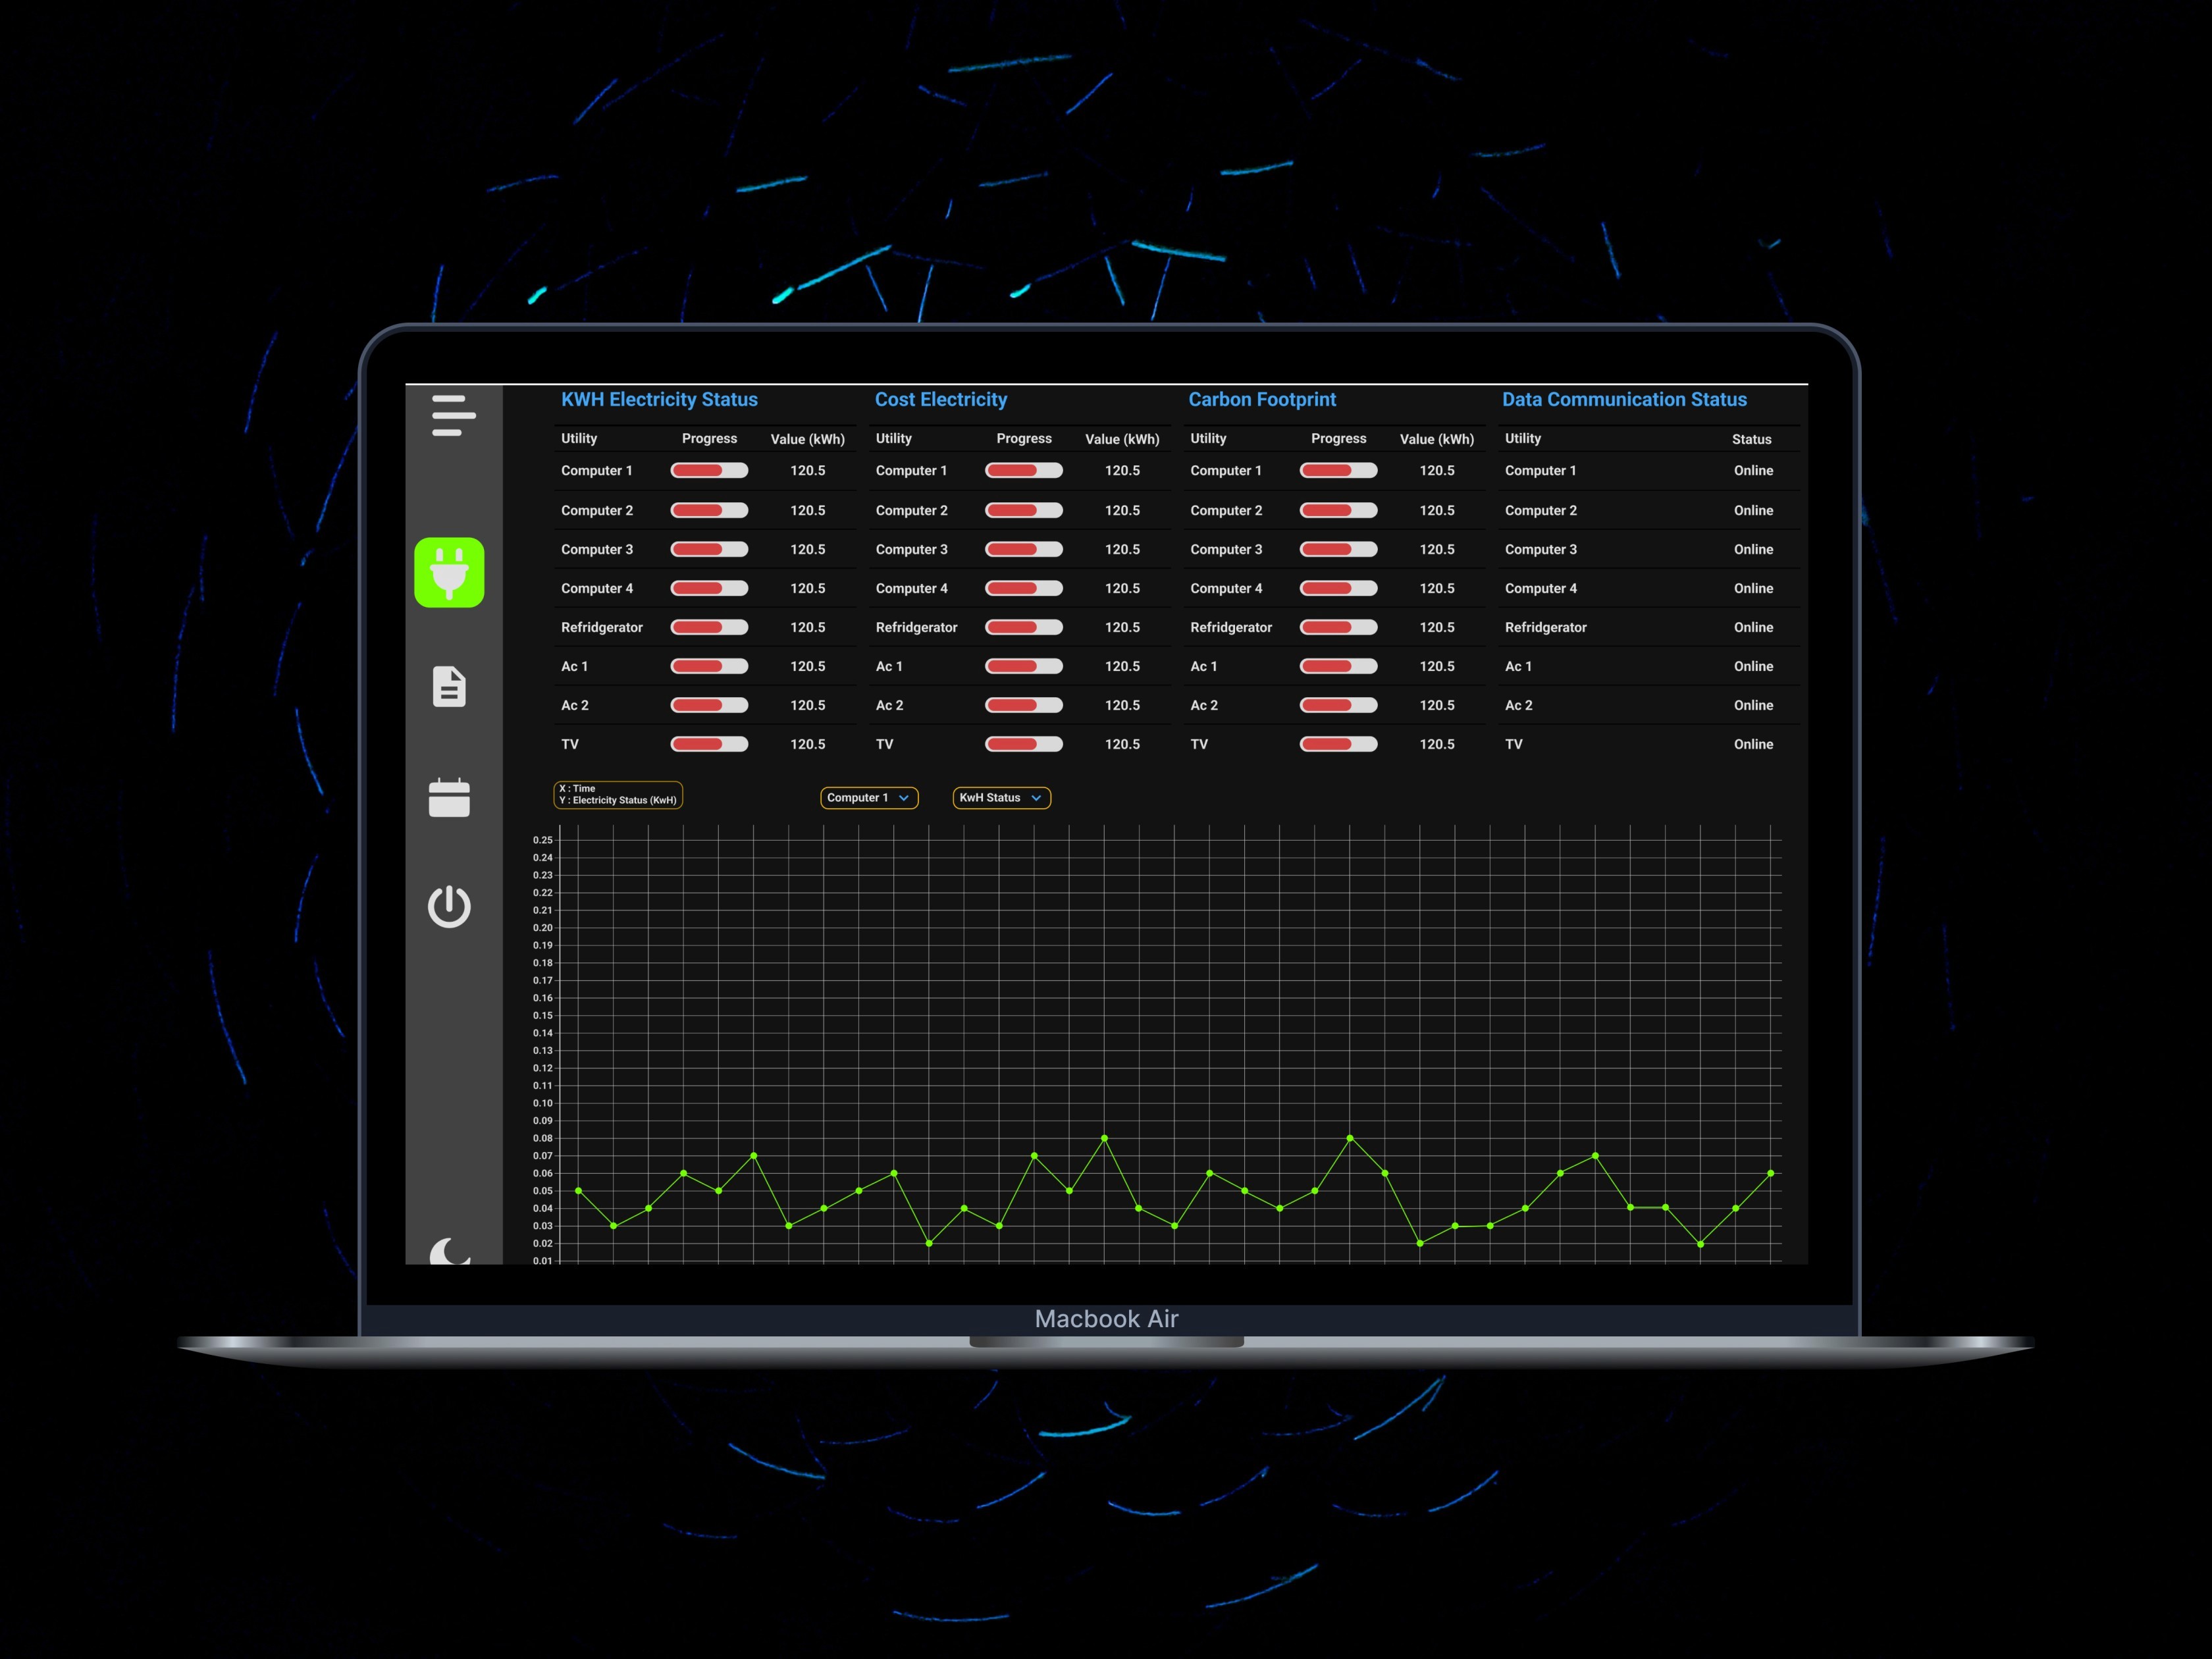
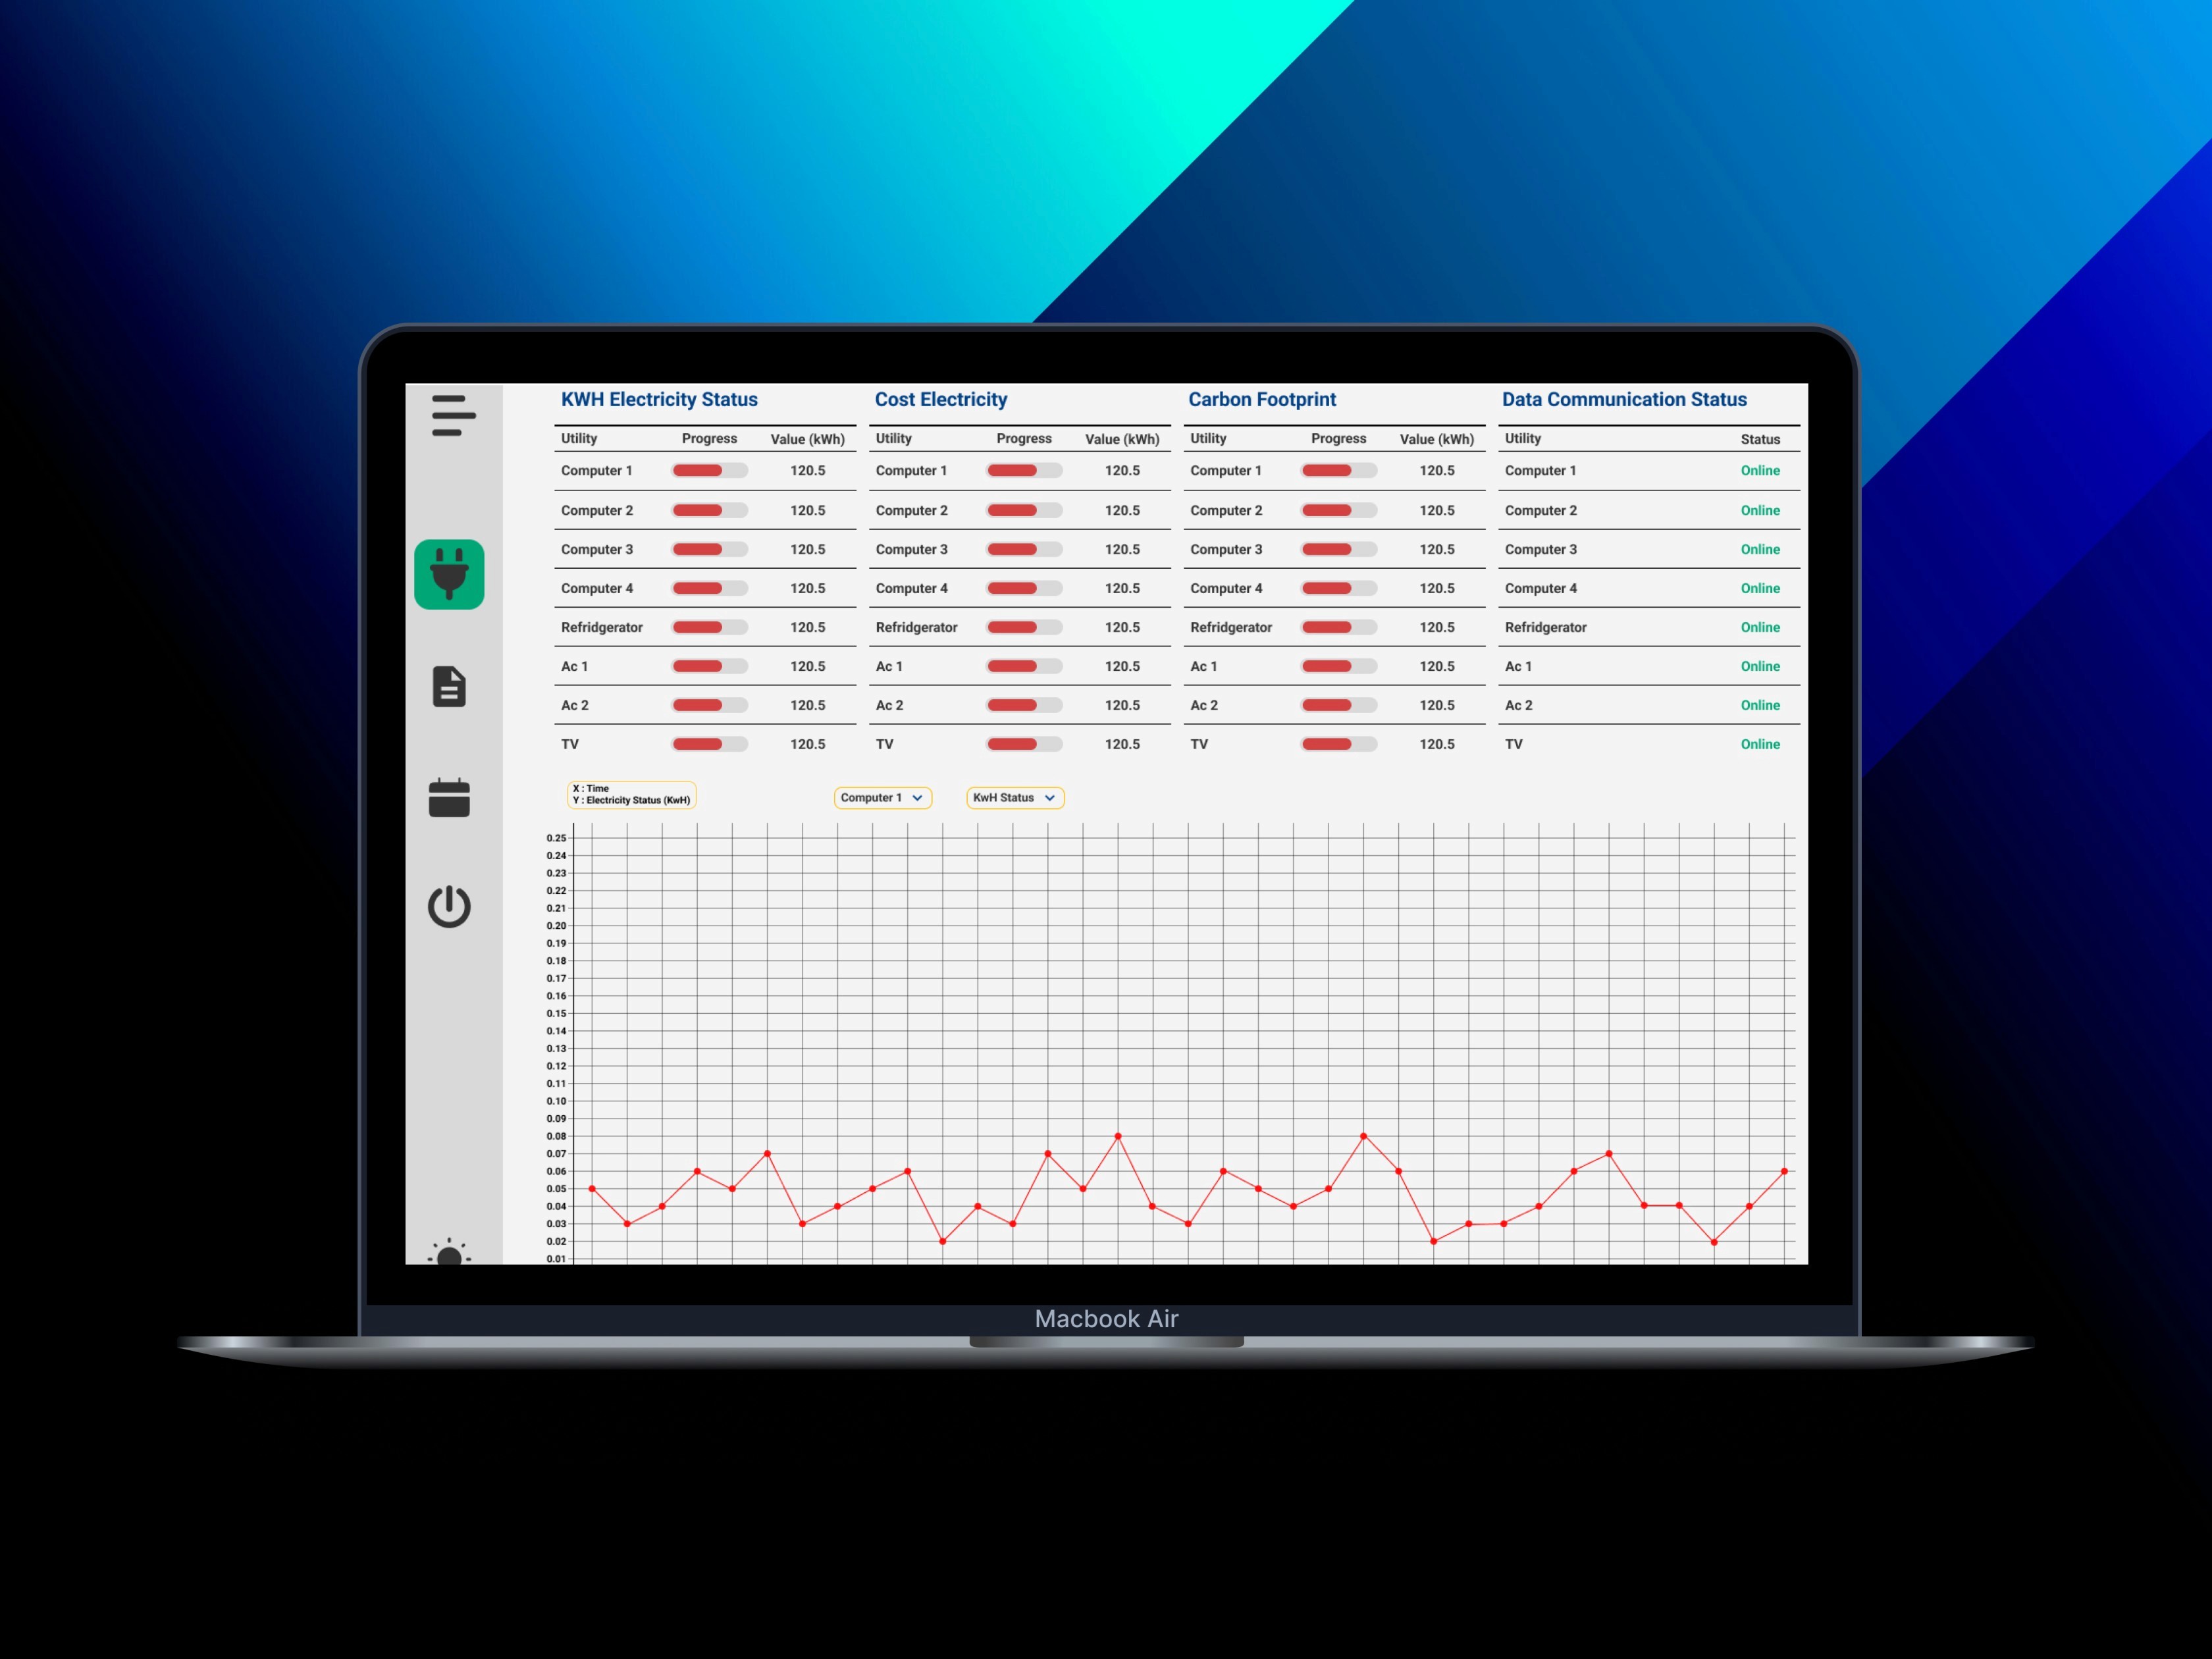
Real-time Energy Monitoring: Smart plugs connected to lab equipment send energy consumption data to the backend, which is then visualized on the frontend.
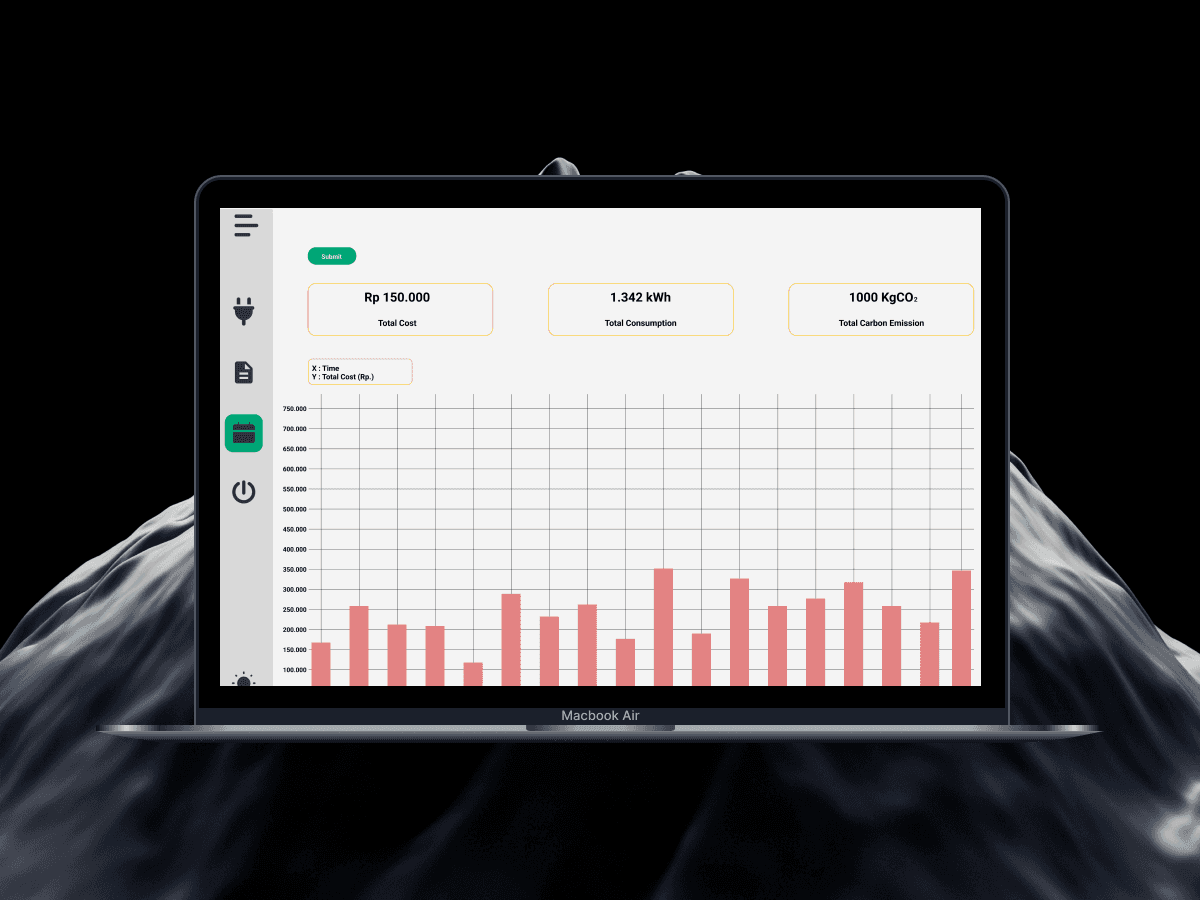
Dynamic Data Visualization: Energy usage is displayed through interactive charts using ChartJS, allowing users to track consumption trends over time.
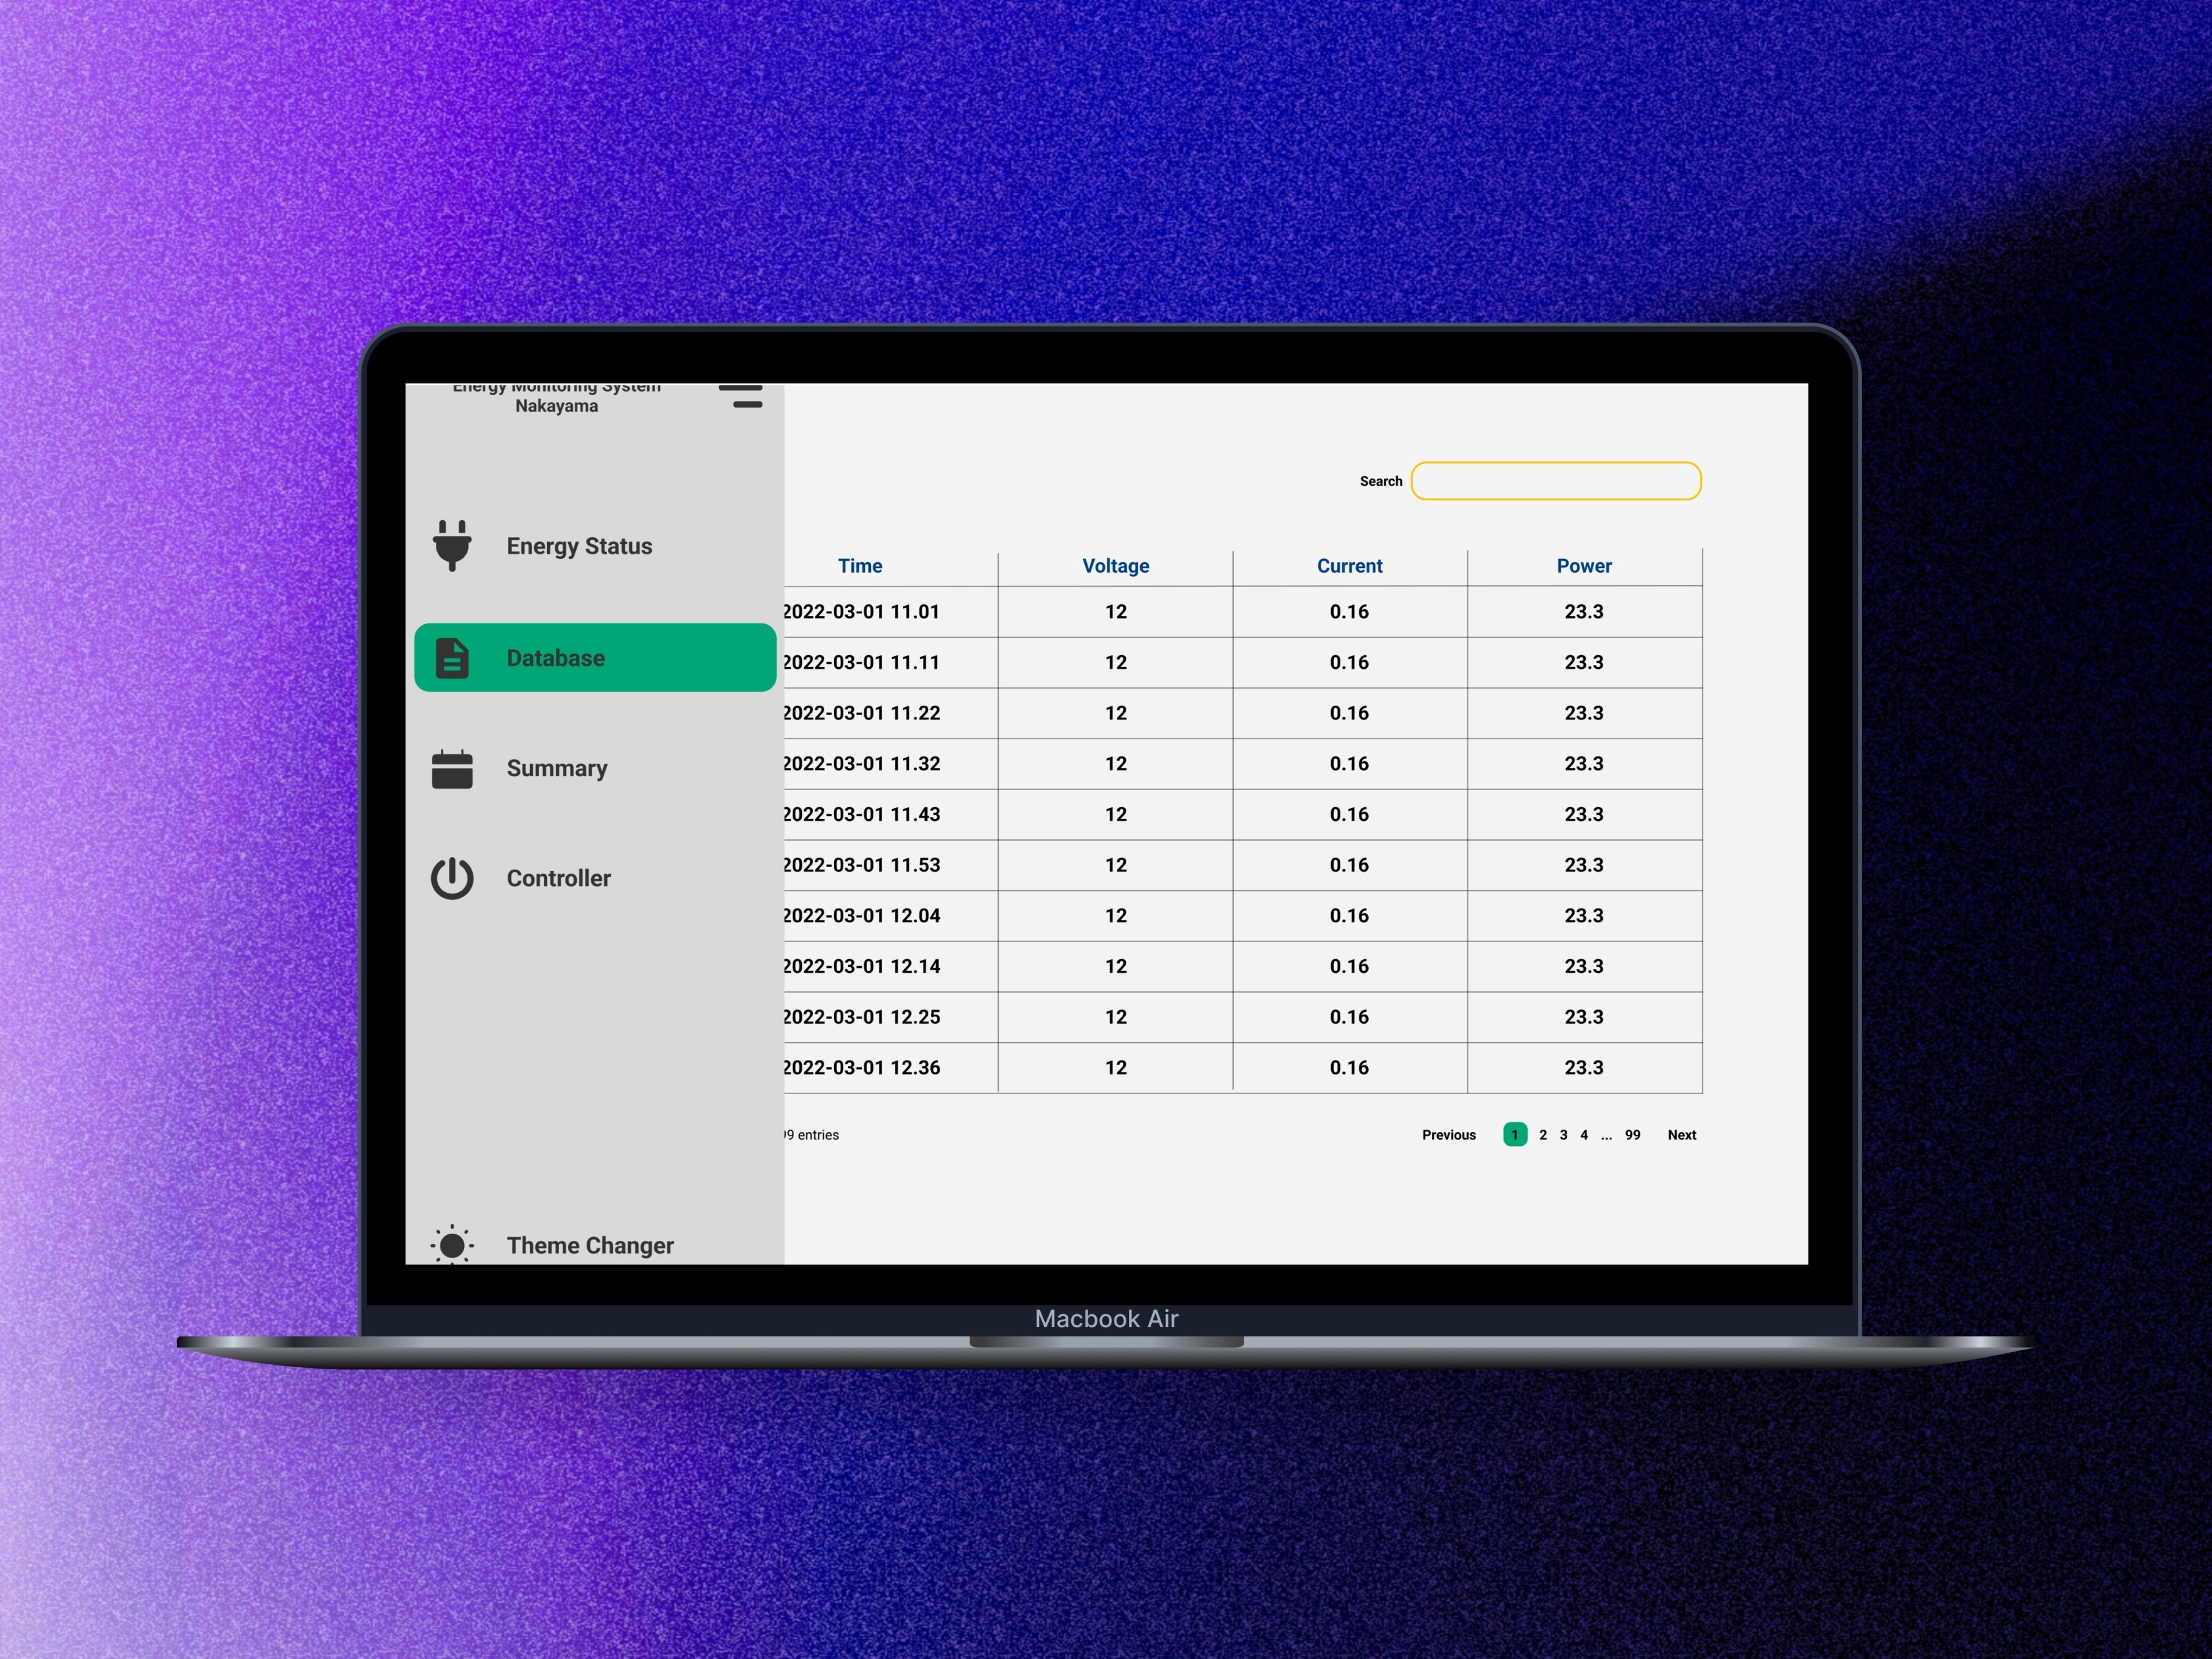
Automated Data Update: Python scripts fetch data from the smart plugs at regular intervals and update the MySQL database, ensuring up-to-date information is always available on the frontend.
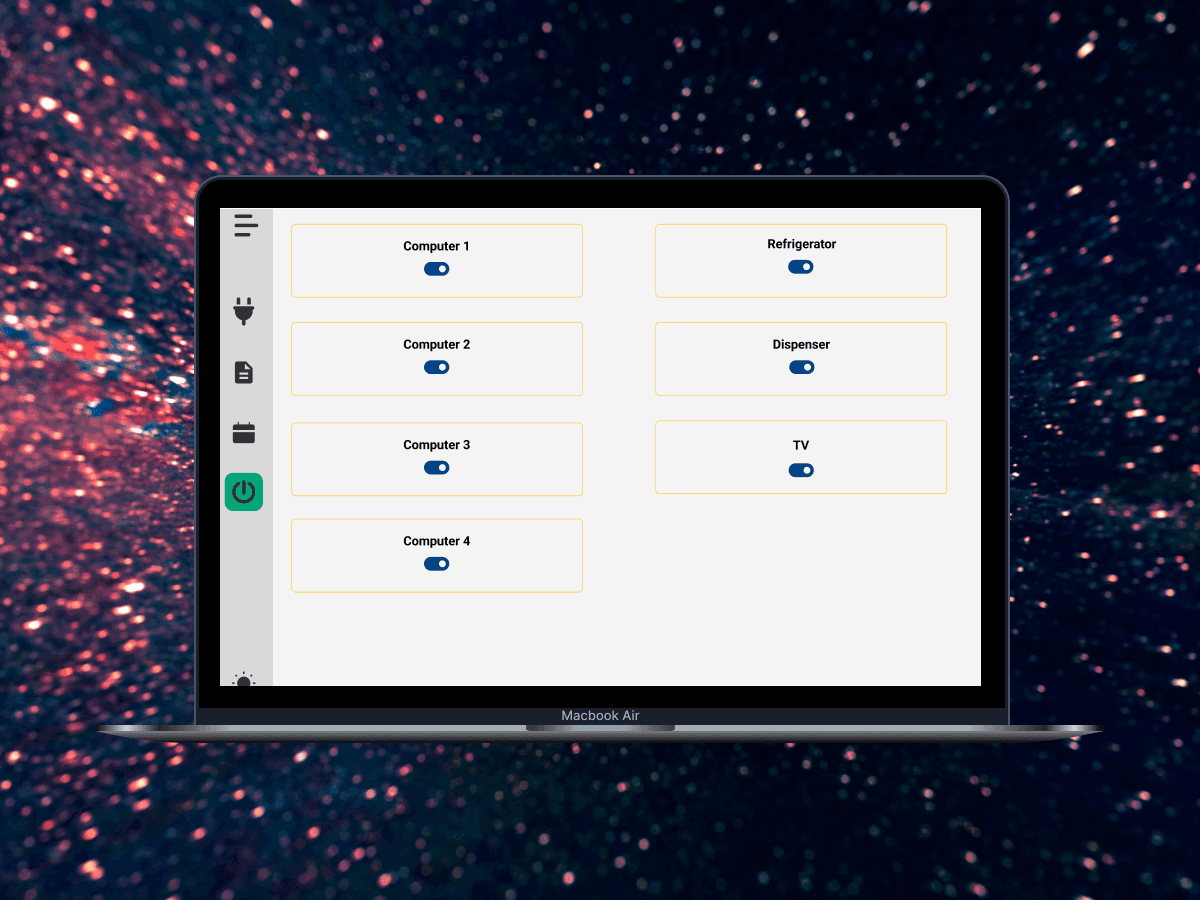
Alerts & Notifications: The system can send alerts if energy consumption exceeds set thresholds, enabling quick action to manage usage.
Mission
The aim of this project was to create a responsive, easy-to-use platform for laboratory personnel to track and analyze energy consumption, with a goal of promoting energy efficiency and reducing unnecessary power usage.
Impact
The Energy Monitoring System helped Nakayama Iron Works achieve a measurable reduction in energy consumption by identifying peak usage times and suggesting operational adjustments. It enabled the team to make data-driven decisions, ultimately contributing to cost savings and improved sustainability efforts.